
Best Time to Visit Palm Springs by Weather and Season
For comfortable weather, November to April is the broadest window for visiting Palm Springs. May and October are warmer transition months, while June to September brings sustained summer heat with average daytime highs above 38°C (100°F), so the best dates depend on your heat tolerance and planned outdoor exposure.
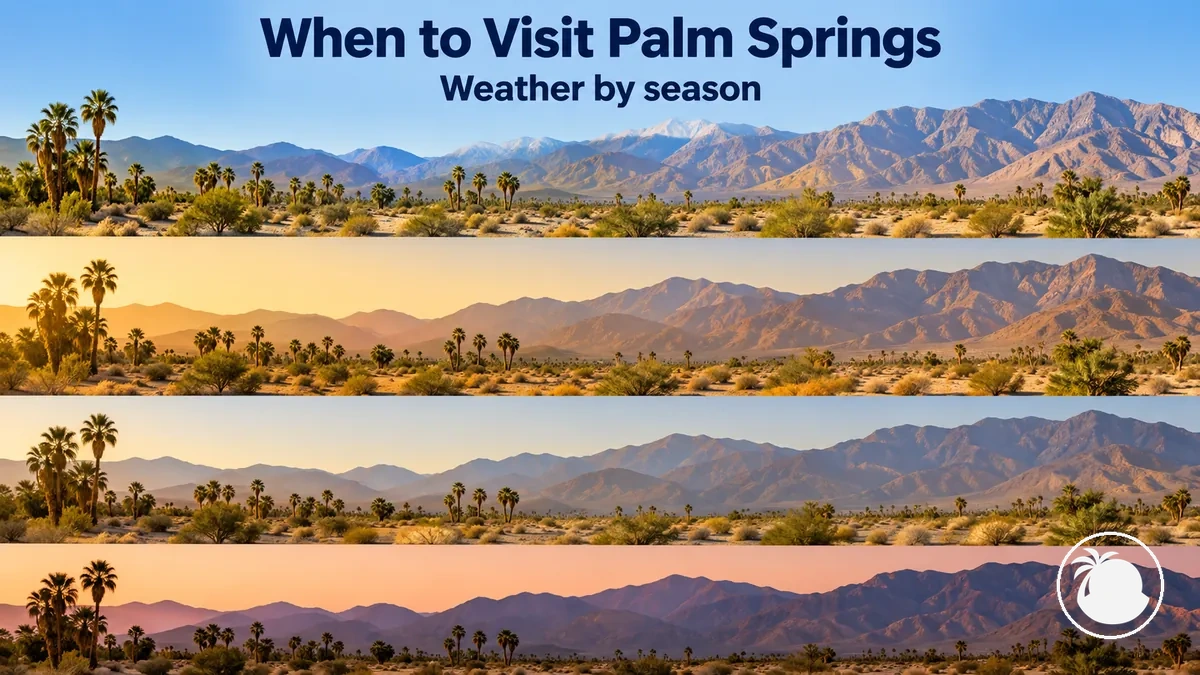
Choose your Palm Springs weather window
Match the seasonal pattern to the level of heat you are comfortable experiencing. The values below are climate normals for planning, not a forecast for a particular day.
Broadest comfort window
November–April
Milder days and cooler nights generally suit the widest range of outdoor sightseeing plans.
Warmer transition
May or October
May is warming toward summer; October is cooling away from it. Both suit travellers with greater heat tolerance.
Sustained summer heat
June–September
Average highs remain above 38°C (100°F), while average overnight lows stay around 22–26°C (71–78°F).
Decision rule: choose November–April for lower heat exposure; use May or October when warmer conditions are acceptable; choose June–September only when sustained very hot days and warm nights fit your plans.
Because Palm Springs has a desert climate, compare both daytime highs and overnight lows when judging comfort. Rainfall and wind can refine the choice, but heat is the dominant seasonal constraint across the year.
Table of Contents
The Most Comfortable Months to Visit Palm Springs
The most consistently comfortable months in Palm Springs generally fall within the November to April cooler-season window, especially when sightseeing involves substantial time outdoors.
U.S. News Travel likewise identifies November through April as the more hospitable weather period, while the monthly climate normals in this article show substantially hotter conditions as summer approaches. October and May are transitional months, so their suitability depends more strongly on heat tolerance and the conditions in a particular year.
Weather comfort is best judged through three connected attributes: daytime warmth, nighttime coolness and exposure to extreme heat.
- Daytime warmth: November to April generally provides milder daytime conditions for outdoor sightseeing, while temperatures rise toward the hotter part of the year.
- Nighttime coolness: Cooler-season nights provide more relief from daytime warmth, so overnight temperatures matter when assessing comfort across a full day.
- Extreme heat: Palm Springs climate normals place average daytime highs above 38°C (100°F) from June through September, making heat tolerance increasingly important outside the cooler-season window.
A traveller with higher heat tolerance may find May or October suitable, while someone prioritising milder conditions will usually find the broader November-to-April window easier to plan around. Climate normals describe typical patterns rather than guaranteed conditions on a particular date.
Palm Springs Weather by Season
Palm Springs follows a clear annual weather cycle: winter is coolest, spring warms toward summer, summer brings peak heat, and autumn cools away from it. Daytime and nighttime temperatures move in the same broad direction, although desert nights remain cooler than daytime conditions within each season.
Rainfall is limited overall, with relatively more precipitation in the cooler part of the year and a smaller late-summer increase. Spring into early summer also carries the clearer seasonal wind signal.

Winter · Dec–Feb
Coolest period, with mild days and distinctly cooler nights.
Spring · Mar–May
Warms quickly: average highs rise from about 27°C to 36°C (80°F to 96°F).
Summer · Jun–Sep
Sustained heat: average highs remain above 38°C (100°F).
Autumn · Sep–Nov
Cools progressively, from summer-like September heat toward the cooler November pattern.
Winter: Mild Days and Cooler Nights
Palm Springs winter combines mild days with noticeably cooler nights from December through February.

- Three-month average maximum
- 20.8°C (69.5°F)
- Three-month average minimum
- 7.9°C (46.2°F)
- December–February precipitation
- 73.9 mm (2.91 in)
These climate normals show a substantial day–night contrast, and individual nights can be colder than the averages. Winter also sits within Palm Springs’ relatively wetter part of the year despite the desert climate.
The practical distinction is simple: winter daytime comfort does not imply warm nights, so judge daytime and evening conditions separately when choosing dates.
Spring: Warm Days Before Peak Heat
Palm Springs spring warms progressively from March through April to May rather than staying within one uniform temperature band.
March
- Average high
- 27°C / 80°F
- Average low
- 11°C / 52°F
April
- Average high
- 31°C / 88°F
- Average low
- 14°C / 57°F
May
- Average high
- 36°C / 96°F
- Average low
- 18°C / 64°F
Wind is also a spring characteristic. A consistent month-by-month wind speed series is not available on the same climate-normal basis used for the temperature table, so wind is best treated here as a seasonal tendency rather than an exact monthly value.
The March-to-May direction is clear: daytime temperatures rise, cooler nights become less pronounced, and Palm Springs moves steadily closer to summer heat.
Summer: Extreme Heat and Very Warm Nights
Palm Springs summer carries the greatest sustained heat burden, combining extreme daytime heat with warm nights and limited overnight relief.

- Average highs, June–September
- 40°C, 42°C, 42°C, 39°C
104°F, 108°F, 107°F, 102°F - Average lows, June–September
- 22°C, 26°C, 26°C, 22°C
71°F, 78°F, 78°F, 72°F - Travel implication
- Average highs exceed 38°C (100°F) throughout June–September.
These are climate-normal averages rather than record temperatures or a forecast for an individual day. The central planning point is that sustained heat extends across four months, not only the single hottest month.
Autumn: Cooling Conditions After Summer
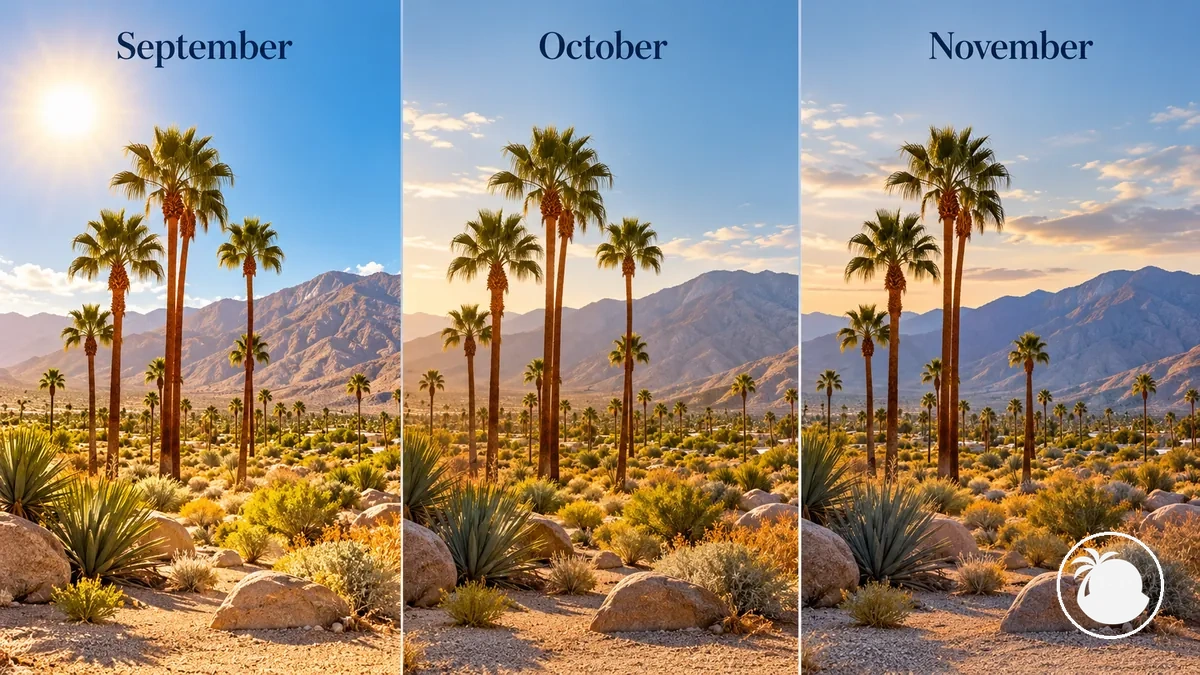
Palm Springs autumn is a cooling transition rather than one uniform period of comfortable conditions. September can remain summer-like before temperatures fall through October and November.
September
- Average high
- 39°C / 102°F
- Average low
- 22°C / 72°F
October
- Average high
- 33°C / 91°F
- Average low
- 17°C / 62°F
November
- Average high
- 26°C / 78°F
- Average low
- 11°C / 52°F
The key attribute is the direction of heat change: early autumn retains substantial heat, while late October and November increasingly approach the broader cooler-season pattern.
Monthly Temperature, Rainfall and Wind Patterns
Palm Springs monthly weather can be compared with long-term climate normals, which are useful for seasonal planning but do not predict the conditions on a specific travel day.
The table uses 1991–2020 monthly normals for average high, average low and rainfall. A comparable monthly wind series is not used on the same measurement basis, so that attribute remains unquantified rather than being mixed with values from a different station or dataset.
| Month | Average high (°C/°F) | Average low (°C/°F) | Rainfall | Wind tendency |
|---|---|---|---|---|
| January | 22°C / 71°F | 7°C / 45°F | 29.5 mm / 1.16 in | Not available on the same monthly basis |
| February | 23°C / 74°F | 9°C / 48°F | 29.5 mm / 1.16 in | Not available on the same monthly basis |
| March | 27°C / 80°F | 11°C / 52°F | 12.4 mm / 0.49 in | Not available on the same monthly basis |
| April | 31°C / 88°F | 14°C / 57°F | 1.3 mm / 0.05 in | Not available on the same monthly basis |
| May | 36°C / 96°F | 18°C / 64°F | 0.5 mm / 0.02 in | Not available on the same monthly basis |
| June | 40°C / 104°F | 22°C / 71°F | 0.5 mm / 0.02 in | Not available on the same monthly basis |
| July | 42°C / 108°F | 26°C / 78°F | 3.6 mm / 0.14 in | Not available on the same monthly basis |
| August | 42°C / 107°F | 26°C / 78°F | 7.4 mm / 0.29 in | Not available on the same monthly basis |
| September | 39°C / 102°F | 22°C / 72°F | 5.6 mm / 0.22 in | Not available on the same monthly basis |
| October | 33°C / 91°F | 17°C / 62°F | 5.1 mm / 0.20 in | Not available on the same monthly basis |
| November | 26°C / 78°F | 11°C / 52°F | 9.7 mm / 0.38 in | Not available on the same monthly basis |
| December | 21°C / 69°F | 7°C / 44°F | 17.8 mm / 0.70 in | Not available on the same monthly basis |
The strongest temperature contrast is between the cooler winter months and July and August, when both average highs and lows reach their annual peak on this measurement basis.
Rainfall remains limited overall: January and February are relatively wetter, late spring and early summer are very dry, and a smaller precipitation increase appears in late summer.
Use these normals to compare broad monthly patterns; for any particular travel date, actual weather can depart materially from the long-term averages.
Hottest Months and Peak Summer Temperatures
July commonly ranks as the hottest month in Palm Springs climate-normal data, although the exact ranking can vary by dataset, station and temperature metric.
The 1991–2020 normals used here place July’s average high at about 42°C (108°F), slightly above August at about 42°C (107°F); the average low is about 26°C (78°F) in both months.
The broader travel constraint is more important than the one-month ranking: average highs remain above 38°C (100°F) from June through September, with average lows around 22–26°C (71–78°F), limiting nighttime relief throughout the hot season.
These values are monthly climate averages, not record temperatures reached during exceptional heat events.
Wettest Months and Seasonal Rainfall
January and February often rank among the wettest months in Palm Springs, even though rainfall remains limited overall. The 1991–2020 normals used here show about 29.5 mm (1.16 in) of precipitation in each month.
That makes them relative precipitation peaks within a desert climate, not periods of continuous rain. The broader wetter period extends from late autumn through winter into early spring, while late spring and early summer are much drier.
Warm-season rainfall follows a different pattern: isolated monsoon-related storms can occur in summer, but their occurrence and intensity vary and do not make persistent rainfall the dominant summer condition.
A “wettest month” therefore describes a relative monthly maximum, not frequent rain on every day; even relatively wetter months can contain many dry days.
Windiest Months and Windier Periods
Palm Springs’ windier period is generally concentrated from spring into early summer, broadly from March into July, with April through June forming the recurring stronger-wind interval described by the seasonal pattern.
This does not mean Palm Springs is always windy during spring and early summer or wind-free during the rest of the year. Stronger winds can affect perceived comfort and outdoor exposure, so day-specific conditions remain important when wind sensitivity matters.
Spring vs Autumn for Shoulder-Season Travel
Spring and autumn can both provide comfortable shoulder-season periods in Palm Springs, but their weather trajectories move in opposite directions: spring warms toward summer, while autumn cools away from it.
The useful comparison is therefore not “which season is always better?” but how daytime warmth, nighttime cooling, wind tendency and the direction of heat change match your tolerance.
| Criterion | Spring | Autumn | Planning implication |
|---|---|---|---|
| Daytime warmth | Warms progressively from March through May. | Cools progressively from September through November. | Later spring increases exposure to heat, while later autumn generally reduces it. |
| Nighttime cooling | Cooler nights are more evident earlier in spring and become warmer toward May. | Nighttime temperatures fall through autumn, providing greater cooling later in the season. | Travellers sensitive to warm nights may interpret early spring and later autumn more favourably. |
| Wind tendency | Generally overlaps the broader March-to-July windier period, with April through June forming the recurring stronger-wind interval. | No equivalent autumn wind concentration is established on the same measurement basis. | Spring carries the clearer seasonal wind signal; actual wind still varies by weather station, location and day. |
| Direction of heat change | Warming toward summer heat. | Cooling away from summer heat. | Heat risk generally rises as spring advances and declines as autumn advances. |
| Most comfortable part of the season | Earlier to mid-spring tends to retain milder conditions before late-spring heat intensifies. | Late October into November increasingly approaches the cooler-season pattern. | Suitable timing depends on heat tolerance rather than one season being preferable for everyone. |
The most consequential trade-off is heat direction: delaying a spring visit moves conditions closer to summer heat, whereas delaying an autumn visit generally moves them toward cooler conditions.
Spring carries the clearer seasonal wind signal, while September can leave autumn with substantial residual heat before cooling becomes more pronounced through October and November.
For lower heat exposure, earlier spring or later autumn will usually be more favourable than late spring or early autumn, but actual comfort still depends on the weather during the visit.
Choosing Travel Dates by Heat Tolerance
Choose Palm Springs travel dates by matching expected heat exposure to your heat tolerance rather than using one universal comfort threshold. Daytime highs, overnight lows, the length of outdoor exposure and the direction of seasonal change all affect how demanding a period may feel.
-
Prefer milder weather
Start with November–April. This is the broadest cooler-weather range for travellers prioritising lower daytime heat and cooler nights.
-
Comfortable with warmer days
Consider May or October. May is warming toward summer; October is cooling away from it, so the same temperature tolerance can feel different depending on seasonal direction.
-
Accept sustained extreme heat
June–September has average highs above 38°C (100°F) and average lows around 22–26°C (71–78°F), so both daytime exposure and warm nights matter.
Overnight lows matter because warmer nights provide less nighttime cooling after very hot days. Travellers planning long periods outdoors should therefore evaluate both the daytime high and the expected overnight low rather than relying on one temperature alone.
November–April generally aligns with lower heat tolerance; May and October are transitional choices; June–September is the sustained summer-heat range. These are planning ranges based on typical seasonal conditions, not guarantees of individual comfort.
Once the weather window is chosen, the Palm Springs first-visit guide provides the broader planning context for the trip.